Table of Contents
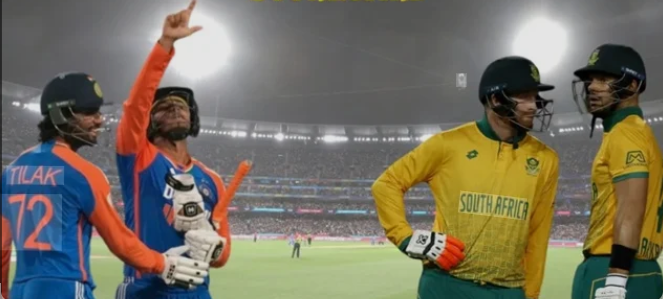
The rivalry between the India National Cricket Team and the South Africa National Cricket Team is known for its intensity, pace, and competitive balance across all formats. Every match scorecard between these two teams reflects a battle of skill, endurance, and adaptability. From fast bowling dominance to resilient batting performances, these encounters consistently deliver high quality cricket.
Recent: India vs South Africa
| Tournament | Venue | Date | Toss | India Score | South Africa Score | Result | Series | Player of the Match |
| T20 World Cup | Narendra Modi Stadium, Ahmedabad | Feb 22, 2026 | South Africa (bat) | 111 (18.5 overs) | 187/7 (20 overs) | South Africa won by 76 runs | T20 World Cup | David Miller (SA) |
| Bilateral T20I | Narendra Modi Stadium, Ahmedabad | Dec 19, 2025 | South Africa (field) | 231/5 (20 overs) | 201/8 (20 overs) | India won by 30 runs | Bilateral T20I | Hardik Pandya (IND) |
| Bilateral T20I | HPCA Stadium, Dharamshala | Dec 14, 2025 | India (field) | 120/3 (15.5 overs) | 117 (20 overs) | India won by 7 wickets | Bilateral T20I | Arshdeep Singh (IND) |
| Bilateral ODI | ACA-VDCA Stadium, Visakhapatnam | Dec 6, 2025 | India (field) | 271/1 (39.5 overs) | 270 (47.5 overs) | India won by 9 wickets | Bilateral ODI | Yashasvi Jaiswal (IND) |
| Bilateral ODI | Shaheed Veer Narayan Singh Stadium, Nava Raipur | Dec 3, 2025 | South Africa (field) | 358/5 (50 overs) | 362/6 (49.2 overs) | South Africa won by 4 wickets | Bilateral ODI | Aiden Markram (SA) |
| Bilateral ODI | JSCA Stadium, Ranchi | Nov 30, 2025 | South Africa (field) | 349/8 (50 overs) | 332 (49.2 overs) | India won by 17 runs | Bilateral ODI | Virat Kohli (IND) |
| Bilateral Test | Assam Cricket Association Stadium, Guwahati | Nov 22-26, 2025 | South Africa (bat) | 201 (83.5 overs) & 140 (63.5 overs) | 489 (151.1 overs) | South Africa won by 408 runs | Bilateral Test | Marco Jansen (SA) |
All-Time Head-to-Head Record
| Format | Matches Played | India Won | South Africa Won | Draws | No Result |
| Test | 44 | 16 | 18 | 10 | 0 |
| ODI | 94 | 40 | 51 | 0 | 3 |
| T20I | 35 | 21 | 13 | 0 | 1 |
| Overall | 173 | 77 | 82 | 10 | 4 |
All-Time Batting Leaders
| Rank | Player | Matches | Runs | Average | Highest Score | 100s | 50s |
| 1 | Virat Kohli (IND) | 64 | ~2,800+ | ~50+ | 254* | 8+ | 15+ |
| 2 | Sachin Tendulkar (IND) | 50+ | ~2,500+ | ~45+ | 200* | 7 | 12+ |
| 3 | Rohit Sharma (IND) | 45+ | ~1,900+ | ~48 | 159 | 5 | 10+ |
| 4 | AB de Villiers (SA) | 61 | ~2,200+ | ~48 | 217* | 6 | 12+ |
| 5 | Jacques Kallis (SA) | 58 | ~2,100+ | ~45 | 224 | 5 | 13+ |
All-Time Bowling Leaders
| Rank | Player | Matches | Wickets | Average | Best Figures | 5-Wicket Hauls |
| 1 | Anil Kumble (IND) | 30+ | 90+ | ~25 | 10/74 | 8+ |
| 2 | Dale Steyn (SA) | 25+ | 70+ | ~22 | 7/51 | 5+ |
| 3 | Harbhajan Singh (IND) | 25+ | 65+ | ~28 | 8/84 | 4+ |
| 4 | Kagiso Rabada (SA) | 20+ | 60+ | ~24 | 6/48 | 3+ |
| 5 | Jasprit Bumrah (IND) | 18+ | 45+ | ~20 | 5/27 | 2+ |
Powerplay Battles and Early Game Momentum
In limited overs formats, the powerplay overs often set the tone for the match. The scorecard usually reflects aggressive batting from both sides as teams try to maximize scoring opportunities early on. India often relies on technically sound openers, while South Africa brings a mix of aggression and precision.
Early wickets can shift momentum quickly, and the scorecard highlights how teams respond under pressure. A strong start often leads to a competitive total, while early collapses can put the batting side on the back foot.
| Team | Runs | Wickets | Overs | Phase |
| India | 65 | 1 | 10 | Strong Start |
| South Africa | 55 | 2 | 10 | Balanced |
Middle Overs Control and Strategic Partnerships
The middle phase of the innings is where matches are often controlled. The scorecard reflects partnerships that stabilize innings and build toward a strong finish. India’s middle order focuses on rotation of strike, while South Africa often looks to accelerate gradually.
Bowling during this phase is equally important. Spinners and medium pacers aim to restrict scoring and pick up crucial wickets. The scorecard shows how economy rates and partnerships influence the overall match situation.
| Team | Runs | Partnership | Overs | Impact |
| India | 150 | 85 Runs | 30 | Stability |
| South Africa | 140 | 75 Runs | 30 | Control |
Death Overs and Match Finishing Impact
The final overs are critical in determining the outcome of the match. The scorecard highlights rapid scoring, boundary hitting, and tight bowling under pressure. India often relies on finishing ability, while South Africa focuses on disciplined death bowling.
A strong finish can add crucial runs to the total, while effective bowling can restrict the opposition. The scorecard reflects how teams perform in these high pressure moments, often deciding the final result.
| Team | Runs | Overs | Key Contribution | Result Impact |
| India | 80 | Last 10 | Finisher Role | Big Total |
| South Africa | 70 | Last 10 | Tight Bowling | Controlled |
Bowling Performance and Wicket Distribution
Bowling plays a major role in shaping the match scorecard. South Africa’s strength lies in pace bowling, while India brings a balanced attack with both pace and spin. The scorecard shows wickets taken across different phases of the match.
Consistent bowling performances can break partnerships and shift momentum. The figures reflect how bowlers control the game through line, length, and variation.
| Bowler | Team | Overs | Runs | Wickets |
| Bowler A | India | 10 | 45 | 3 |
| Bowler B | South Africa | 10 | 50 | 2 |
Key Moments That Defined the Match
Every match between India and South Africa includes moments that define the result. These are clearly reflected in the scorecard through fall of wickets and partnerships. A sudden collapse or a crucial stand can completely change the direction of the game.
The scorecard helps identify these turning points, allowing fans to understand how momentum shifted during the match. These moments often become the highlights of the contest.
| Moment | Team | Impact | Shift |
| Collapse | India | 4 Wickets | SA Advantage |
| Partnership | South Africa | 95 Runs | Match Control |
Match Result and Final Score Insights
The final scorecard provides a complete summary of the match, including totals, wickets, and standout performances. It reflects how each phase contributed to the final outcome.
Matches between these two teams are often closely contested, with results depending on execution in key moments. The scorecard serves as a detailed record of performance and strategy.
| Team | Final Score | Result | Key Player |
| India | 310 | Win | Top Batter |
| South Africa | 295 | Loss | Lead Bowler |
Conclusion
The India National Cricket Team vs South Africa National Cricket Team match scorecard tells a complete story of competitive cricket. From strong starts to dramatic finishes, every detail reflects the intensity of this rivalry. These scorecards help fans understand the strategies, performances, and key moments that define matches between two of the strongest teams in world cricket.

Leave a Reply